Introduction
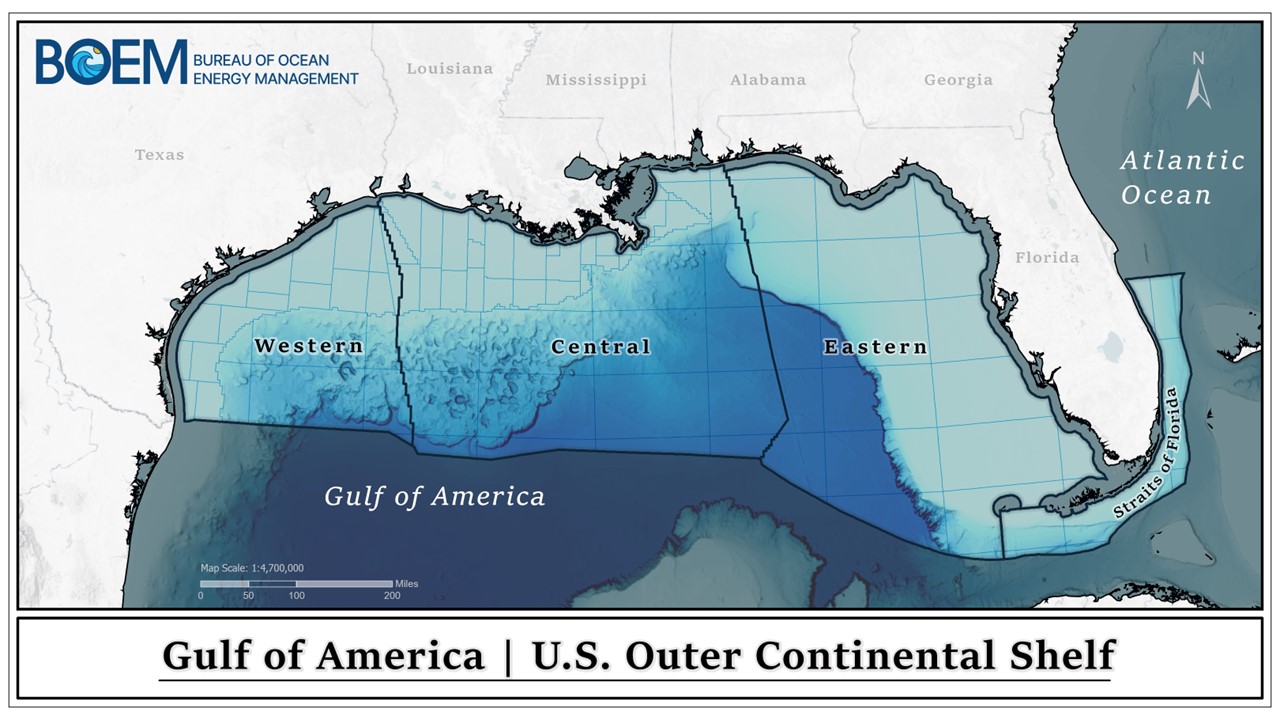
This Estimated Oil and Gas Reserves Report (EOGR) Fact Sheet provides an overview of the Bureau of Ocean Energy Management’s (BOEM) estimates of oil and gas reserves on the Gulf of America (GOA) Outer Continental Shelf (OCS) as of December 31, 2023. This Fact Sheet will be followed by a comprehensive EOGR report. The GOA OCS encompasses the submerged seabed, whose mineral rights are governed by Federal jurisdiction (Figure 1). For oil and gas fields that span both State and Federal waters, reserves are estimated exclusively for the Federal portion. These estimates are derived for individual reservoirs through geological, geophysical, and petroleum engineering analyses. In 2020, BOEM transitioned from deterministic to probabilistic reserves estimation. This probabilistic methodology is consistent with the Society of Petroleum Engineers et al. (2022), Petroleum Resources Management System (PRMS) to better account for the uncertainty with reserves estimations. Over the past four years, BOEM has developed probabilistic workflows and methodologies leading to the revisions of 1,336 fields and over 37,000 reservoirs. Utilizing these methodologies, reserves estimates have increased by 1.30 billion barrels of oil equivalent (BBOE) since the EOGR was published in 2021, reaching a total of 7.04 BBOE (Table 1). The total is comprised of 5.77 billion barrels (Bbbl) of oil and 7.15 trillion cubic feet (Tcf) of gas.
Outer Continental Shelf Lands Act (OCSLA) requires the Department of the Interior to conduct ongoing investigations to assess the availability of all oil and gas produced or located on the Outer Continental Shelf (OCS). To meet this requirement, BOEM develops independent estimates of economically recoverable volumes of oil and gas in discovered fields through comprehensive field reserve studies. These estimates are continuously updated to incorporate new information from development and production activities and are published annually in the Estimated Oil and Gas Reserves Report.
| OIL (Bbbl) | Gas (TCF) | BOE (Bbbl) | |
|---|---|---|---|
| Original Reserves: | |||
| Previous Estimate, as of 12/31/2019 | 26.77 | 197 | 61.83 |
| Reserves from Fields Added 2020-2023** | 0.52 | 0.49 | 0.60 |
| Revisions from Ongoing/Daily Reservoir Maintenance 2020-2023 * | 3.14 | 3.68 | 3.79 |
| Estimate, as of 12/31/2023 | 30.43 | 201.17 | 66.22 |
| Cumulative Production: | |||
| Previous Estimate, as of 12/31/2019 | 22.12 | 190.9 | 56.09 |
| Production during 2020-2023 | 2.54 | 3.12 | 3.09 |
| Estimate, as of 12/31/2023 | 24.66 | 194.02 | 59.18 |
| Remaining Reserves: | |||
| Previous Estimate, as of 12/31/2019 | 4.65 | 6.10 | 5.74 |
| Reserves from Fields Added 2020-2023** | 0.52 | 0.49 | 0.60 |
| Revisions from Ongoing/Daily Reservoir Maintenance 2020-2023 * | 3.14 | 3.68 | 3.79 |
| Production during 2020-2023 | -2.54 | -3.12 | -3.09 |
| Estimate, as of 12/31/2023 | 5.77 | 7.15 | 7.04 |
Table 1. Summary and Comparison of GOA oil & gas reserves as of December 31, 2019, and December 31, 2023. All 2023 estimates represent mean values.
*Reservoir maintenance may include geologic modelling to adjust volumetrics to accommodate production, tracking declining production trends, and placement of new completions.
** Reserves from Fields Added are the results of new Field Studies necessary to estimate the volume of in-place and recoverable reserves by using all available data to analyze geological, geophysical, and petroleum engineering characteristics of individual reservoirs.
Methodology
BOEM utilizes three techniques for estimating reserves: analog, volumetric, and performance. Reserve estimates presented in this Fact Sheet are primarily based on volumetric and performance methods. Volumetric reservoir analysis utilizes a geologic model based on subsurface data interpretation and petrophysical well log analysis to define vertical and lateral boundaries of a hydrocarbon-bearing reservoir to calculate bulk volume. Probabilistic reserves estimates require the development of distributions for reservoir rock and fluid properties and recovery factors. These distributions are sampled utilizing a Monte Carlo simulation to arrive at a range of recoverable volumes. By contrast, the previous deterministic methodology requires only a single, most likely, value for each parameter. Once a reservoir begins producing and a production trend is observed, decline curve analysis along with volumetric techniques are employed to forecast future reservoir performance.
Reporting
Previous EOGRs presented reserves as proved plus probable (2P) deterministic estimates, adhering to the classifications established in the PRMS. Table 2 offers an overview of past EOGRs in five-year increments from 1975, followed by annual increments beginning in 2015. Mean reserves for the 2025 Fact Sheet were derived starting at the reservoir level. Reservoir level estimates account for the full range of uncertainty from P0 (smallest value in the dataset) to P100 (largest value in the dataset). Once finalized, reservoir reserve estimates are aggregated up to the field level to get mean reserve estimates for each field. Mean reserves for each field are then summed to get original reserves (production + reserves) estimates. BOEM then subtracts produced volumes to calculate remaining reserves. The total volume of oil and oil-equivalent gas is referred to as barrel of oil-equivalent (BOE) and is reported in barrels at standard conditions.
Summary
Since the 2020 transition to probabilistic reserves estimation, BOEM has conducted in-depth studies on more than 140 fields, including 18 new discoveries. BOEM also reviewed over 37,000 reservoirs in 1,336 fields across the GOA OCS. As a result of these analyses, 4.39 BBOE original reserves were added. After accounting for 3.09 BBOE of production within this timeframe, the remaining reserves increased by 1.30 BBOE or 22.6% (Table 1). Increases in reserves can be attributed to the addition of nearly 250 new reservoirs and ongoing reservoir maintenance. Full probabilistic results will be provided in the upcoming 2025 EOGR.
| Year | Number of fields included | Original Reserves | Historical Cumulative Production | Reserves | ||||||
|---|---|---|---|---|---|---|---|---|---|---|
| Oil (Bbbl) | Gas (Tcf) | BOE (Bbbl) | Oil (Bbbl) | Gas (Tcf) | BOE (Bbbl) | Oil (Bbbl) | Gas (Tcf) | BOE (Bbbl) | ||
| 1975 | 255 | 6.61 | 59.9 | 17.27 | 3.82 | 27.2 | 8.66 | 2.79 | 32.7 | 8.61 |
| 1980 | 435 | 8.04 | 88.9 | 23.86 | 4.99 | 48.7 | 13.66 | 3.05 | 40.2 | 10.20 |
| 1985 | 575 | 10.63 | 116.7 | 31.40 | 6.58 | 71.1 | 19.23 | 4.05 | 45.6 | 12.16 |
| 1990 | 782 | 10.64 | 129.9 | 33.75 | 8.11 | 93.8 | 24.80 | 2.53 | 36.1 | 8.95 |
| 1995 | 899 | 12.01 | 144.9 | 37.79 | 9.68 | 117.4 | 30.57 | 2.33 | 27.5 | 7.22 |
| 2000 | 1,050 | 14.93 | 167.3 | 44.70 | 11.93 | 142.7 | 37.32 | 3.00 | 24.6 | 7.38 |
| 2005 | 1,196 | 19.80 | 181.8 | 52.15 | 14.61 | 163.9 | 43.77 | 5.19 | 17.9 | 8.38 |
| 2010 | 1,282 | 21.50 | 191.1 | 55.50 | 17.11 | 179.3 | 49.01 | 4.39 | 11.8 | 6.49 |
| 2015 | 1,312 | 23.06 | 193.8 | 57.56 | 19.58 | 186.5 | 52.78 | 3.48 | 7.3 | 4.78 |
| 2016 | 1,315 | 23.73 | 194.6 | 58.37 | 20.16 | 187.5 | 53.58 | 3.57 | 6.8 | 4.79 |
| 2017 | 1,319 | 24.65 | 195.2 | 59.66 | 20.78 | 188.9 | 54.21 | 3.87 | 6.3 | 5.00 |
| 2018 | 1,319 | 24.86 | 195.5 | 59.66 | 21.42 | 189.8 | 55.21 | 3.44 | 5.7 | 4.45 |
| 2019 | 1,325 | 26.77 | 197.0 | 61.83 | 22.12 | 190.9 | 56.09 | 4.65 | 6.1 | 5.74 |
| 2023 | 1,336 | 30.43 | 201.2 | 66.22 | 24.66 | 194.0 | 59.19 | 5.77 | 7.2 | 7.04 |
Table 2. Oil and gas reserves and cumulative production at end of year, 1975-2023, Gulf of America, Outer Continental Shelf and Slope. "Oil" includes crude oil and condensate; "gas" includes associated and non-associated gas. Reserves estimated as of December 31 each year.
The Department of the Interior’s Bureau of Ocean Energy Management (BOEM) manages development of U.S. Outer Continental Shelf (OCS) energy, mineral, and geological resources in an environmentally and economically responsible way.