How Does BOEM Analyze the Different Sizes of Oil Spills?
| Category | Size | How Does BOEM Analyze |
|---|---|---|
| Small | Less than 1,000 barrels | Small spill analysis in NEPA documents |
| Large | Greater than or equal to 1,000 barrels | Oil Spill Risk Analysis (OSRA) |
| Catastrophic | Greater than 1 million barrels | Extreme Value Theory (EVT) |
The OSRA model considers spills greater than or equal to 1,000 barrels (1 percent of all spill events on the U.S. OCS) because those spills would persist on the water long enough for the model to follow its path in a trajectory analysis. Although spills less than or equal to 10 barrels in size account for 99 percent of all spill events on the U.S. OCS, they do not lend themselves to trajectory modeling. Therefore, small spills are addressed in a separate small spill analysis in the NEPA documents.
Catastrophic spills are accidental oil spills with volumes greater than 1 million barrels (MMbbl). The risk of a catastrophic spill cannot be produced by the OSRA model due to the small sample size of catastrophic spills. To estimate the risk of one of these rare events occurring, BOEM uses Extreme Value Theory (EVT).
How OSRA Works
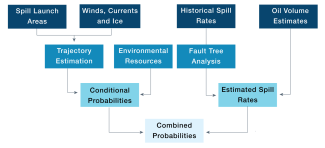
OSRA considers
- Oil spill occurrence rates (estimated spill rates)
- Oil spill trajectories and probability of contact (conditional probability) with an environmental resource
- The combined probability of an oil spill occurring and contacting with an environmental resource
Definitions
Spill Launch Areas: Hypothetical spill location (platforms, pipelines, tankers, etc.) from which trajectories are simulated. A proposed study area is organized into a system of launch areas that are used to represent exploration or development.
Winds and Ocean Currents: OSRA uses historical surface wind and ocean current data over large areas (thousands of kilometers) and long periods of time (years to decades). Surface wind and ocean currents are from model reanalysis based on historical meteorological and oceanographic observation data.
Trajectory Estimation: Simulated movement of a single hypothetical oil spill as a point with no volume and no weathering. Based on model-simulated historical wind, current, and ice (if in the Artic) data, generally for 30 days (or up to 360 days in the Arctic) or until it contacts “land” or moves out of the study area.
Environmental Resources: A pre-designated area of interest. Resource areas include Environmental Resource Areas, Land Segments, Grouped Land Segments, and Boundary Segments. Each resource is digitalized to OSRA model grid and input to the OSRA model. Land is treated as a special environmental resource comprising an entire coastline, including major islands. Land segments, which are generally of equal length or based on county or borough boundaries, allow the OSRA model to specify where the contacts to land occur.
Historical Spill Rates: Spill rates, expressed in terms of estimated mean number of spills per billion barrels of oil handled/wells drilled/pipeline miles, have been calculated based on historic drilling, production, transportation, and accident reports. Separate rates have been calculated for U.S. OCS platform spills, U.S. OCS pipeline spills, U.S. OCS barge spills and worldwide tanker spills.
Oil Volume Estimates: The estimates of undiscovered, unleased, conventionally recoverable oil resources are based on a comprehensive appraisal of the conventionally recoverable petroleum resources of the U.S. There are inherent uncertainties in these estimates, which the OSRA model is designed to account for when modeling probabilities based on oil production volume inputs. The estimates of the portion of the resources assumed to be leased, discovered, developed, and produced as a result of the proposed action are based upon logical sequences of events that incorporate past experience, current conditions, and foreseeable development strategies. BOEM uses a wealth of historical data and information derived from more than 50 years of oil and gas exploration, development, and production activities.
Conditional Probabilities: Probability that a hypothetical oil spill will contact an environmental resource. Conditional probabilities are based on the assumption (condition) that an oil spill occurs at a given location. They reflect the hypothetical paths (trajectories) that oil would take based on modeled ocean surface currents, ice (if appropriate), and surface wind conditions in the study area.Tens of thousands of trajectories are simulated from each hypothetical spill point, and the number of contacts to environmentally sensitive areas and land segments within 3, 10, and 30 days (and additionally 60, 180, and 360 days in the Arctic) of travel time are tabulated. The percentage of the trajectories contacting a given environmental resource area is a measure of the "conditional probability" of an oil spill contacting that resource area; with the assumption (condition) being that a large spill occurs at a hypothetical launch area. Conditional probabilities do not incorporate the likelihood of a spill occurring.
Fault Tree Analysis: Because there are no recorded large oil spill data in the offshore Arctic, the Alaska Region derives large oil spill rates using fault tree analysis. This method uses a graphical logic structure—called a fault tree—and analyzes the probability of events that could lead to a large oil spill in order to estimate the large oil spill rate.
Estimated Spill Rates: The OSRA model estimates the probability of oil spills occurring during the production and transportation of a specific volume of oil over the lifetime of the scenario being analyzed. The mean spill occurrence estimate is obtained by multiplying the spill rate constant by the volume of oil projected to be handled, which results in the mean number of spills estimated to occur relative to the hypothetical volume of oil produced.
Combined Probabilities: The overall (combined) estimated probability of one or more spills of 1,000 barrels or greater occurring and contacting an environmental resource over the lifetime of the scenario. Combined probabilities do incorporate the likelihood of a spill occurring.
How Many Large Platform Spills Have Occurred?
Source: Stalfort D, Roberts B, Culvern C (ABSG Consulting, Inc., Spring, TX). 2021. Alternative oil spill occurrence estimators for determining rates for the Atlantic Outer Continental Shelf. Sterling (VA): US Department of the Interior, Bureau of Ocean Energy Management. 97 p. Report No.: OCS Study BOEM 2021-065.
The figure above captures data for 194 spills of at least 50 barrels in size in the Gulf of America from 1974 to 2019. Although only a fraction of the total spill count, spills ≥ 50 barrels account for more than 99.7% of the volume of the oil spills considered in this analysis. Note that two spills are not shown to scale: the 2010 Deepwater Horizon spill (the largest US offshore spill to date at 4.9 million barrels) and the 2004 Taylor Energy spill (which has leaked much more slowly than Deepwater Horizon, but it has flowed for far longer). Taylor Energy oil spill is the longest continuous oil spill in the U.S. history since Hurricane Ivan toppled Taylor Energy’s MC20 platform in 2004, and it was largely contained by the U.S. Coast Guard and private contractors in 2019. Here, Taylor Energy oil spill is treated as a single 50,000 bbl spill occurring in 2004 by combing all persistent spills from the Taylor Energy site into one record.
Example OSRA Calculation: Gulf of America
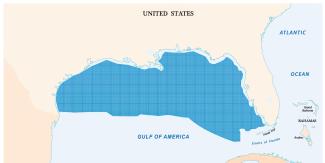
For the GOA Region lease sales in 2017, BOEM conducted OSRA for the GOA Region (Ji et al. 2017).
The calculation involved
- 184 offshore environmental resources
- 130 onshore resources
- 210 land segments
- 16 boundary segments
- 6,600 launch points
- 15 years of ocean current and wind
- 40 million trajectories
Catastrophic Oil Spills
Catastrophic spills are accidental oil spills with volumes greater than 1 million barrels (MMbbl). The Deepwater Horizon spill in 2010 is an example of a catastrophic spill and is the largest accidental marine oil spill in history (Ji et al. 2014). A subset of large spills, these are exceedingly rare events with a frequency too low for traditional statistical analysis.
The specific risk of a catastrophic spill (as a subset of all large oil spills of 1,000 or more barrels) cannot be produced by the OSRA model due to the small sample size of catastrophic spills. To estimate the risk of one of these rare events occurring, BOEM uses Extreme Value Theory (EVT) (Ji et al. 2014). EVT allows BOEM to estimate these rare events even though the bureau lacks the necessary data for OSRA analysis.
Calculating Risks of Catastrophic Spills
Catastrophic oil spill events are just one of the many EVT applications. The EVT approach is widely used in the analysis of extreme events worldwide, including hurricanes, stock market crashes, and global warming.
For spills of this size, there is only a single data point in the U.S.—Deepwater Horizon. Outliers drive the statistical analysis of catastrophic events, unlike standard statistical analyses where outliers are ignored. The distinguishing aspect for catastrophic oil spill analysis is fitting a model to a set of extreme event data, which are the tail end of a complete data distribution (Ji et al. 2014).
The EVT analysis is focused on the probability of oil spill occurring for the entire OCS program.
The estimated annual probability of a catastrophic oil spill occurring on the US OCS is 0.6%, with a return period of 165 years with a 95% confidence interval between 41 years and more than 500 years (Ji et al. 2014). This probability is not additive, and the risk of occurrence remains the same each year. The 0.6% risk of a catastrophic event is for the entire U.S. OCS where oil and gas development occur (i.e., Alaska, Pacific, and GOA Regions). Similarly, the average time between potential occurrences of spills (i.e., return period) was calculated by Ji et al. (2014) using data from the entire U.S. OCS as well.
Limitations of BOEM’s EVT Analysis
Due to the large regional representation in Ji et al. (2014), the return period and the probability of a catastrophic spill occurring on the US OCS cannot be assumed as equivalent for the GOA Region alone. The results are an upper bound (or at least a very conservative estimate) of oil spill risk in the Gulf. It is highly likely that an analysis focused on a more geographically specific area, i.e., the Gulf, would produce lower oil spill risk because the Gulf is only one part of the OCS. Oil spill risk does vary by region and by a particular operation. Applying the same catastrophic spill risk and return rates to only one region would be invalid and overestimate the return period and probability of a spill in the Gulf, because the Gulf is a subregion of the entire OCS. Furthermore, the study conducted by Ji et al. (2014) focused on oil spills that occurred in the OCS and excluded oil spills in other parts of the world.


